

Radiologist $alary Update 2020: Show Me The Money!
One of the most popular posts on The Reading Room is about radiologist compensation (FYI: it’s worth clicking on the link for the title of said blog post alone). Alas, as money still doesn’t grow on trees, it seemed like a good idea to give the post a facelift and update the numbers. Note: the prior post also included a review of partnership terms and buy-in, buy-out arrangements that you may want to revisit.

Now, SHOW ME THE MONEY!
Okay, yes, that’s a reference to the film Jerry Maguire. And don’t worry, I’ll dig into the good stuff—the green, the dough, the moolah—shortly, but first a few words of sense and context.
Have average salary figures gone up or down? Does your paycheck stack up to other radiologists in a similar practice? What is “average” anyway?
In this post, we’ll get down with the data, sort through the most recent figures, and cover some other important salary considerations, so you’ll be armed with all the info you need to ensure you get a fair shake in 2020 and beyond.

Remember: you don’t get paid what you’re worth, you get paid what you negotiate.
I know that you want to be paid fairly for your hard work and that you want your compensation to reflect what you’re worth. One of the best tools at your disposal for negotiating fair compensation is salary data. It’s easier to make your case for a higher salary if you can show a potential employer what other radiologists with similar qualifications, in a like position, in the same geographic area, are being paid. But please remember: you don’t get paid what you’re worth, you get paid what you negotiate.
Compensation is not all about salary
Before you diplomatically ask your boss or potential employer for more money, make sure you understand the total compensation package. It should be clear whether you are/will be an employee, an employee on a partnership track, a partner, or an independent contractor. Independent contractors are self-employed and generally do not receive the same (or any of) the benefits offered to employed individuals. The value of employer-paid benefits is a big-ticket item that is likely to be the equivalent of between 10% and 20% of total cash compensation. The most valuable benefits are typically insurance (health, life, disability, malpractice), retirement plans, and paid time off.
Compensation can consist of salary alone or also include bonus, profit-sharing, or other forms of remuneration. In any type of practice, salary might be determined in part by work relative value units (RVUs). Other ways practices may measure work productivity include patients seen (especially for interventional radiologists with a clinic schedule), hours worked, fees billed, fees collected, or profit for the entire practice. Academic RVUs, metrics for scholarly activity, are more commonly a component of a compensation plan in an academic setting.
What’s an average radiologist salary? It depends who you ask…
Salary data is available from several sources, although some may charge a fee and have various access restrictions. The data used by most groups and institutions are from the American Medical Group Association (AMGA), Medical Group Management Association (MGMA), and the Association of American Medical Colleges (AAMC) surveys. Salary information is generally reported separately for interventional radiology, neurointerventional radiology, non-interventional radiology, and nuclear medicine/radiology.
Colleagues and mentors can also be useful sources of information and fellow trainees are usually happy to share salary and other benefit information that they’ve acquired from their job search.
And now, what you’ve been waiting for – lots of different $alary figures!
The AMGA Medical Group Compensation and Productivity Survey (in its 33rd year in 2020) is considered the gold standard for benchmarking compensation and productivity in large, multispecialty medical groups and other organized health systems. It focuses on the individual compensation and productivity of physicians and other clinical staff, starting salaries of new residents and experienced new hires, as well as salaries for physician leadership, nurse practitioners, and physician assistants. Survey results are segmented by medical specialty and are broken down by size of group and geographic region.
The 2020 survey included data from 317 medical groups representing more than 127,000 practicing clinicians and showed that diagnostic radiologists in the U.S. had a median compensation of $509,447, compared with $482,599 in 2019. Data collection started in January 2020. Salary and work RVUs varied by size of group:
| Radiologist salaries by number of employees | ||
| Practice type | Median annual salary | Work RVUs |
| All practices | $509,447 | 10,020 |
| 50 to 150 employees | $589,730 | 9,920 |
| 151 to 300 employees | $578,826 | 11,236 |
| More than 300 employees | $504,183 | 9,918 |
How to get it: Provider and non-provider organizations can purchase the survey for $3,200. AMGA members and corporate partners receive a 50% discount. You can get a free summary of the radiology data on Aunt Minnie.com. Note for residents and fellows: Your radiology department business administrator may have access to salary survey information and be willing to share a few relevant numbers with you.
The 2020 MGMA Compensation and Production Report represents comparative data from more than 168,000 providers in 6,300 organizations. The report is based on a voluntary response by MGMA member and nonmember practices. Data collection opened January 2020, reflective of 2019. Participants included private practices, hospitals, integrated delivery systems, universities and academic departments. The MGMA provides annual compensation (total pay, bonus/incentives, retirement), productivity (work RVUs, total RVUs, professional collections and charges), and benefit metrics (hours worked per week/year and weeks vacation) for physician-owned, hospital-owned and academic practices for a variety of regions, practice sizes and provider experience levels.
According to an April 7, 2020 MGMA Stat poll, 97% of medical practice leaders reported a drop in patient volume amid the COVID-19 pandemic. A separate COVID-19 financial impact report by MGMA found that, on average, practices reported a 55% decrease in revenue and 60% decrease in patient volume since the beginning of the COVID-19 crisis. These significant impacts to medical practices of all sizes and specialties forced many to lay off and/or furlough staff.
How to get it: This information is available free of charge to contributors/members and for a fee to non-contributors.
Below are Fiscal Year (FY) 2021 compiled salary/wRVU data from MGMA, AMGA and McGladrey Pullen surveys, broken down by subspecialty:
| Non-Interventional Radiology | Interventional Radiology | Neurointerventional Radiology | Nuclear Medicine | |
| Weighted | $503,917/9,691 | $560,030/7,093 | $545,635/10,252 | $392,560/5,863 |
| MGMA | $532,695/9,719 | $526,107/6,868 | $518,265/10,257 | $393,027/5,352 |
| McGladrey | $498,691/9,500 | $598,988/6,642 | $495,275/8,497 | $395,361/5,588 |
| AMGA | $482,599/9,809 | $551,676/7,457 | $572,749/10,605 | $391,166/6,148 |
Note: In FY2020, the weighted median salary for non-interventional radiology, using combined data from MGMA, AMGA, and McGladrey Pullen surveys was $489,126. The weighted median salaries for interventional radiology, neurointerventional radiology, and nuclear medicine were $566,115, $573,499, and $461,715, respectively.
The AAMC Faculty Salary Report provides updated compensation data from the FY 2019 survey of 151 accredited U.S. medical schools.
How to get it: Faculty and staff at member institutions may purchase the paper publication (one year of data) for $155 and one-year access to the online version (three years of data) for $43. For non-members, the costs are $590 and $1,150, respectively.
The Association of Administrators in Academic Radiology Departments (AAARAD) conducts annual Physician Salary & Productivity surveys.
How to get it: Access to AAARAD Surveys is available exclusively to AAARAD members in the Members Only section of their website. If you are at an academic institution, the radiology business administrator may be able to share select information with you.
Other sources of salary information are freely available online:
Doximity’s study is drawn from self-reported compensation surveys completed in 2019 and 2020 by approximately 44,000 full-time, licensed U.S. physicians who practice at least 40 hours per week. Radiology ranked as having the 10th highest average salary ($485,460, compared with $429,000 in 2018-2019) and nuclear medicine was ranked 20th.

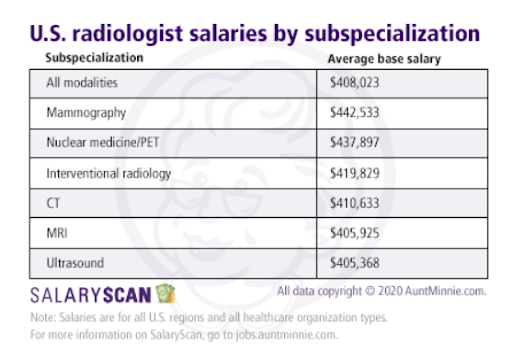
The Aunt Minnie SalaryScan is based on data acquired from AuntMinnie.com members in the U.S. from January to February 2020. AuntMinnie.com members can conduct searches on comparable salaries in their professions, regions, and states by going to the SalaryScan data query tool in AuntMinnie.com‘s Radiology Jobs section. In 2020, the average radiologist salary was $408,023 (compared with $394,000 in 2019).
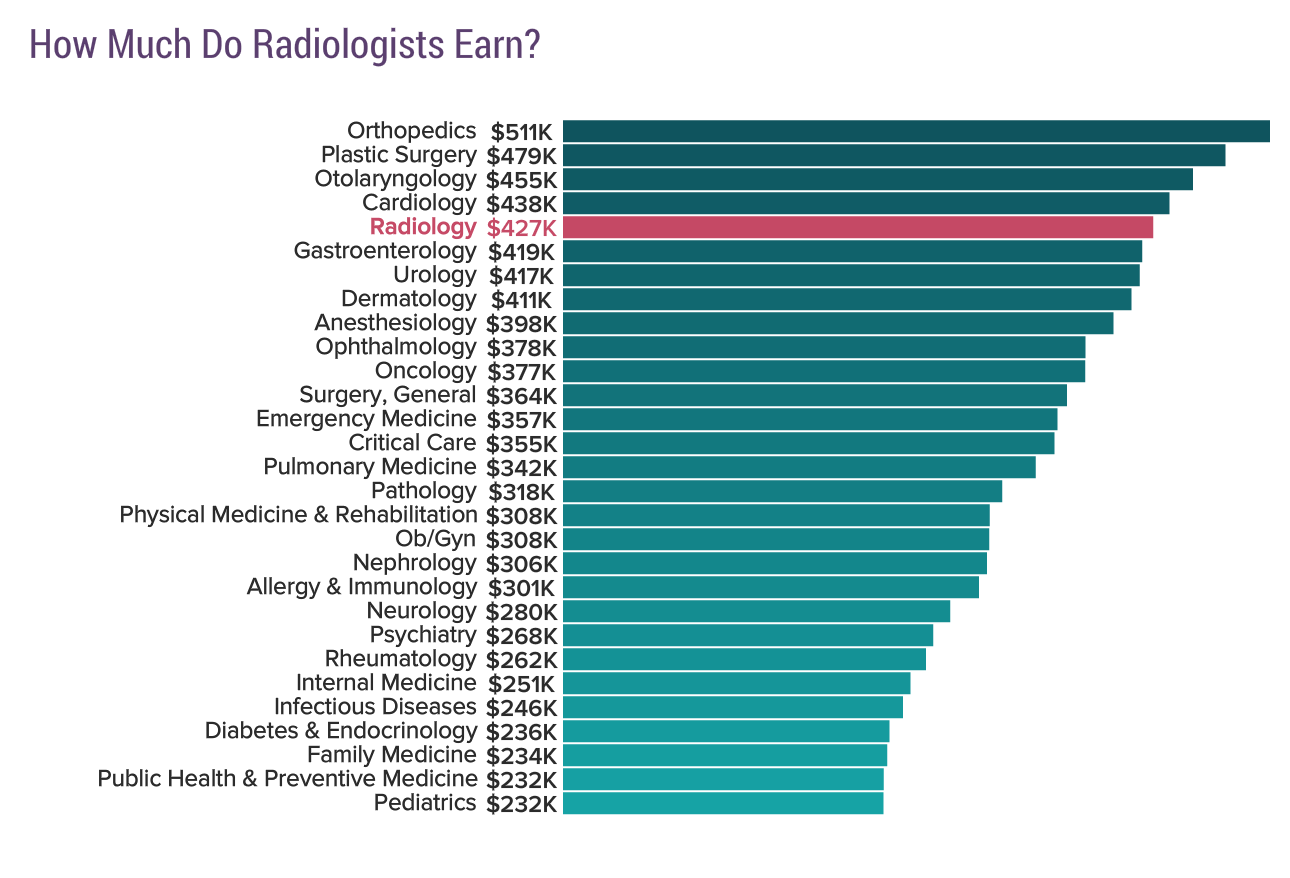
The 2020 Medscape Radiologist Compensation Report showed the average radiologist salary to be $427,000 (compared with $419,000 in 2019). The data was collected prior to February 2020 and reflected physician salary prior to the onset of the COVID-10 pandemic. For employed physicians, compensation included salary, bonus, and profit-sharing contributions. For self-employed physicians, it included earnings after taxes and deductible business expenses, before income tax. 56% of radiologists received an incentive bonus, averaging $77,000. Male radiologists earned 14% more than female peers (compared with 15% more in 2019). The average salary for men was $438,00 and for women was $386,000.
Medscape 2020 Radiologist Compensation Report
Data published by Salary.com showed the median radiologist salary in the United States to be $418,000 on November 2, 2020 (compared with $406,690 on June 27, 2019), with a range between $314,089 (10th %tile) and $544,106 (90th %tile). With bonus, the median salary was $432,090.
Each year for the last 27 years, Merritt Hawkins has released its Review of Physician and Advanced Practitioner Recruiting Incentives, which tracks the starting salaries and other incentives offered to recruit physicians. In addition to salary, signing bonus, relocation allowance and other data, the Incentive Review features an analysis of the physician recruiting market — the types of facilities that are recruiting physicians, the kinds of physicians they are recruiting, and why they are recruiting them. The 2020 report (based mostly on data gathered prior to the emergence of COVID-19) tracks a sample of 3,251 physician and advanced practitioner recruiting engagements conducted by Merritt Hawkins from April 1, 2019, to March 31, 2020. It shows an average radiologist starting salary to be $423,000. The analysis of findings suggests that the previously robust job market for physicians has softened since the emergence of COVID-19.
KISS (Keep It Simple Stupid) table of most recent $alary data:
| Salary ($1,000) | |
| AMGA | 509 |
| MGMA (non-IR) | 533 |
| McGladrey (non-IR) | 499 |
| Doximity | 485 |
| AuntMinnie | 408 |
| Medscape | 427 |
| Salary.com | 418 |
| Merritt Hawkins | 423 |
Closing words
There you have it. Last year I was able to report numbers from a survey of private practice radiologists who attended the 2018 Economics of Diagnostic Imaging conference (Larry Muroff, MD, FACR, personal communication). That information isn’t available this year, but it’s worth noting that the salaries reported from that survey were higher than those from other surveys. This isn’t surprising, as it’s well known that private practice radiologists, on average, earn more than radiologists working in other job types.
Last year, the starting salaries (without benefits) being offered to radiologists right out of fellowship training were between $300K-$349K (59% of respondents). Average income, excluding benefits, for private practice groups that did not collect technical component was most commonly between $400K-$499K (33%) or $500K-$599K (33%), although the range was between $300K and $899K. In groups that did collect technical component, the average annual income was most commonly between $500K-$599K (40%), $400K-$499K (20%), $600K-$699 (20%), or $700K-$799 (20%). Benefits added about $100K to a shareholder’s compensation, and about $45K to the compensation for a new hire.
Remember that the first offer is usually not the best offer.
If you’re looking to join a private practice group I strongly urge you to talk to past alumni from your residency/fellowship program and any other connections you have who are willing to share salary information with you. The best data will be from people working in a group that is similar in size, function, and location to the group you are considering. No matter the type of job you’re considering, remember that the first offer is usually not the best offer. If you can’t negotiate a higher salary, but surveys show that the salary offered isn’t in line with what other groups offer, you can try to negotiate a sign-on bonus or other benefits to make up for it. Remember that the salary you start with will influence the salary you have down the road, as increases are often based on starting salary.
Unless, of course, you can figure out how to finally make money grow on trees. You should probably go ahead and re-read the preceding sentence.